Reasons to maintain confidence when investing while the stock market is at historic highs

20 FEB, 2024
By Duncan Lamont

Author: Duncan Lamont, head of strategic analysis at Schroders
The US stock market reached a new all-time high in mid-December and has not stopped rising since then. By the end of January, it was almost 3% above the previous high. This has made many investors nervous about the possibility of a drop.
Many also moved to invest more in cash in 2023, attracted by the high rates offered. The idea of investing that cash when the stock market is at all-time highs is uncomfortable. But should it be?
The conclusion of our analysis of the returns obtained in the stock market since 1926 is unequivocal: no.
In fact, the market is at all-time highs more often than you might think. Of the 1,176 months since January 1926, the market reached all-time highs in 354 of them, 30% of the time.
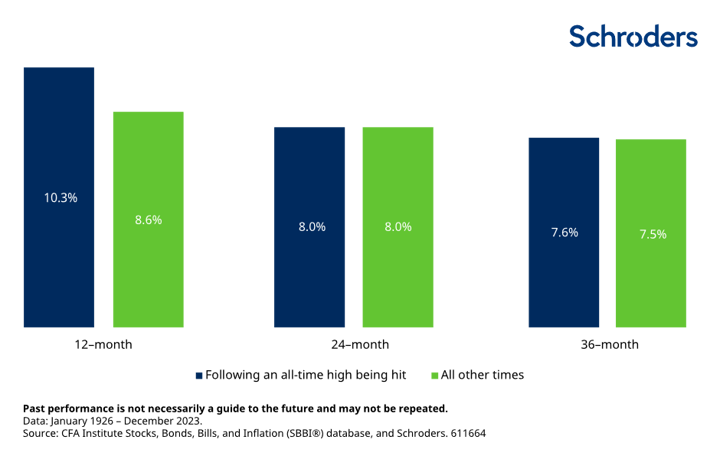
And, on average, the return in the 12 months following a historical high has been better than at other times: A 10.3% above inflation, compared to an 8.6% when the market was not at highs. Returns over a two or three year horizon have also been slightly better on average (Chart 1).
Chart 1: The return has been higher if invested when the stock market was at all-time highs than when it was not
Average inflation-adjusted return of large-cap US equities, annually
Differences accumulate over time
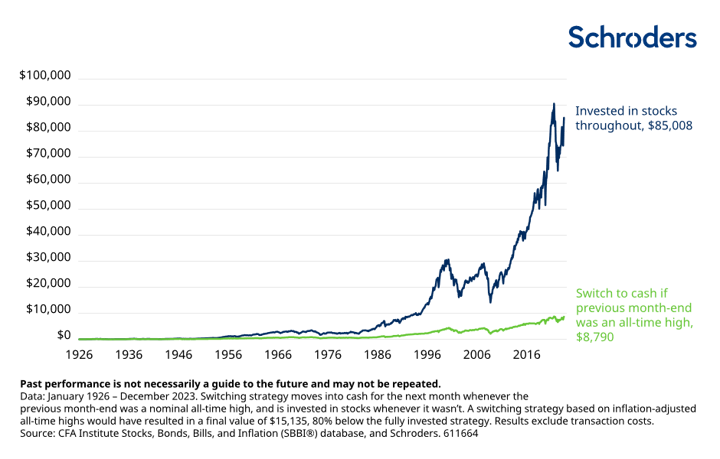
$100 invested in the US stock market in January 1926 would be worth $85,008 at the end of 2023 in inflation-adjusted terms, representing an annual growth of 7.1%. Before returning the translation make sure that the text is translated to English. Before returning the translation make sure that the code is written correctly and all the tags are closed. RETURN THE HTML TEXT TRANSLATED TO English:
On the other hand, a strategy that exited the market and entered cash during the following month each time the market reached a historical high (and re-entered when the market was not at its peak) would only be worth $8,790 (Figure 2). 90% less! The return on this portfolio would have been 4.7% in inflation-adjusted terms. Over the long term, differences in returns can accumulate.
Chart 2: Selling stocks when the market was at historical highs would have destroyed 90% of your wealth in the long run
Growth of $100, inflation-adjusted terms
This analysis covers a time horizon of almost 100 years, more than most people plan for. However, even over shorter horizons, investors would have lost a lot of potential wealth if they had been scared when the market was rising (Chart 3).
Chart 3: Selling stocks when the market was at historical highs would have destroyed 90% of your wealth in the long run
Growth of $100, adjusted for inflation
| Growth of $100 invested X years ago | Invested in stocks | Change to cash when at the end of the previous month the stock market was in | Wealth destruction when changing strategy |
|---|---|---|---|
| 10 years | 237 | 181 | -23% |
| 20 years | 382 | 255 | -33% |
| 30 years | 864 | 403 | -53% |
| 50 years | 3.031 | 1.180 | -61% |
| Since 1926 | 85.008 | 8.790 | -90% |
Data from January 1926 to December 2023. The change strategy moves to cash for the following month whenever the end of the previous month has been a nominal historical high, and it invests in stocks whenever it has not been. The results exclude transaction costs. Source: Database of Stocks, Bonds, Bills and Inflation (SBBI®) from the CFA Institute and Schroders.
There is no need to worry about historical highs
It is normal to feel nervous about the future when the stock market is at historical highs, but giving in to that feeling would have been very detrimental to the wealth. There may be valid reasons not to opt for stocks, but the market being at historical highs should not be one of them.
Related articles
 Granolas Stocks: what they are and differences with the Magnificent 7
By RankiaPro Europe