Lessons from the past on how to position equity portfolios in a US presidential election year

6 MAR, 2024
By Pierre Debru from WisdomTree

Pierre Debru, Head of Quantitative Research & Multi Asset Solutions, WisdomTree
Since the first edition of the Stock Trader’s Almanac in 1967, the influence of the US presidential cycle on equity markets has been widely discussed. While current geopolitical and economic conditions impact markets more sharply, those political considerations can still inform investors’ decisions.
The third year of a presidential term is usually the strongest for equity markets
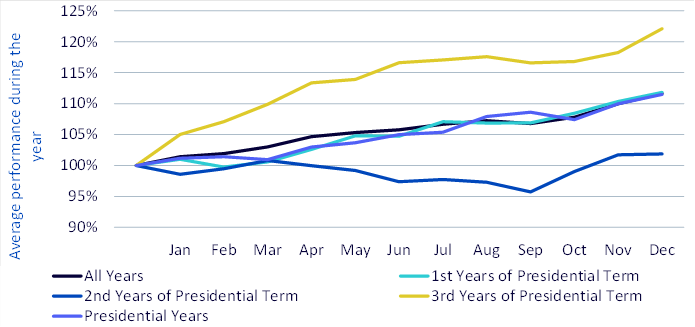
In Figure 1, we plot the average trajectory of US equity markets over each year of the four-year US presidential cycle. For that purpose, we use data from the Kenneth French data library, starting in June 1963, which includes all CRSP firms incorporated in the US and listed on the NYSE, AMEX, or NASDAQ. The data covers almost 15 presidential terms and ten different presidents (five from each party).
The strongest year, by quite a margin, tends to be the third year in a presidential term. On average, US equity markets gain 22%, while the average performance over a year (independently of the year in the presidential term) is 11.6%. The second year in the term is the weakest, with a performance average of 1.9%.
The first year of the term and the last year of the term, i.e. the presidential election year, show average performance. Both years return on average around 11%. Having said that, looking more closely at the trajectory of equities in this fourth year, we note that the first trimester tends to be quite weak, with almost no performance created. Then the second and third quarters are the strongest with around 4% of performance each and the last quarter is a bit weaker at 2.6%.
Figure 1: Average US equity market performance depending on the year in the presidential term, June 1963 - November 2023
Anecdotally, here is the performance of the S&P 500 during the Biden Term:
- 2021: +28.6%
- 2022: -18.51%
- 2023: +25.67%
- 2024 (up to 13 February): +3.95%
So, in line with the pattern, the third year proved to be the strongest of the term so far, and the second year was the weakest by far. The first year in Biden’s term was above average though.
High quality and value stocks love a presidential year
Digging further into this presidential term data, we can try to compare the performance of different type of stocks. In Figure 2, we focus on four ways to split the US markets:
- High quality / low quality
- Large / small caps
- Cheap / expensive – based on Price to Earning Ratio (PE)
- High or low dividend payer
Figure 2: Average factor performance during the final year of the presidential term, June 1963- November 2023
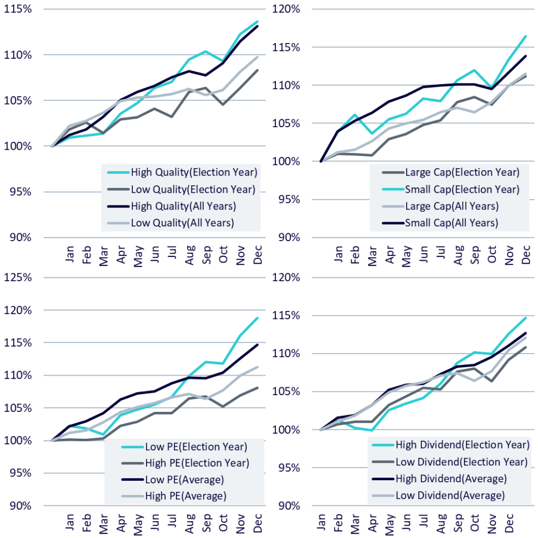
Across all four analyses we note that the premium usually observed between both groups of stocks is exacerbated in election years:
- On average, high quality stocks outperform the market, while low quality stocks underperform the market. This creates a 3.4% performance differential in favour of high quality on an average year. In presidential election years, this differential is increased by almost 2% to 5.3%. The reason is that high quality does even better than usual and low quality does even worse.
- On average, small caps outperform the market, while large cap stocks mostly match the market. This creates a 2.4% performance differential in favour of small caps in an average year. In presidential election years, this differential is increased by almost 3% to 5.3%. The reason is that small caps do a lot better than usual.
- On average, value stocks outperform the market, while expensive stocks underperform, slightly. This creates a 3.4% performance differential in favour of value stocks on an average year. In presidential election years, this differential is increased by more than 7% to 10.8%. The reason is that value stocks do a lot better than usual and expensive stocks do a lot worse.
- Finally, on average, high dividend stocks outperform the market, while low dividend stocks underperform slightly the market. This creates a 0.5% performance differential in favour of high dividends in an average year. In presidential election years, this differential is increased by almost 3.5% to 3.8%. The reason is that high dividend stocks do even better than usual, and the low dividend stocks do even worse.
Timing-wise, this exacerbation of factor performance is not homogeneous. High quality tend to outperform almost the full year on a regular basis with a slightly stronger 2nd and 3rd trimester. The other three create the extra outperformance mostly in the second half of the year, after being dominated in the first half.
Conclusion
2024 is not a year to sit on the sidelines. The presidential cycle suggests positive equity performance could be expected in the last nine months of the year. Factors like high quality, high dividend, value stocks and small caps could benefit in those periods. Interestingly enough, this positioning aligns well with our current market outlook, which favours high dividend and quality stocks to adapt to the current uncertainty in the market, wrought by the many elections around the world (half the world’s population is voting in 2024) and the unpredictability of Central Banks around monetary loosening. But also to benefit from expected rate cuts in the second half of the year, which could push markets higher.