India’s path to Sustainable & Inclusive Growth
3 MAR, 2021
By
Achieving sustainable, inclusive growth is a delicate balancing act for any country. This balance is needed across all societal fault lines – age, gender, wealth, minorities, urban-rural, literacy level, to list a few. India's reforms over the past few years have been directionally positive despite the lack of pervasive results in the short term. Enabling the economically vulnerable segment to reach self-sufficiency has rightly become the dominant goal of the Modi Government.
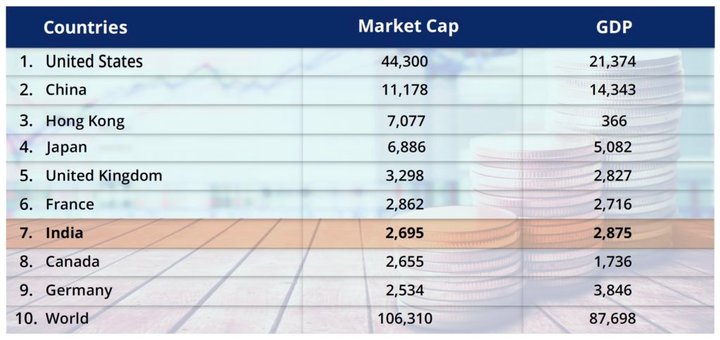
Improving the standard of living at the bottom of the pyramid not only reduces societal inequalities but creates tomorrow's consumers. While socio-economic changes are slow to take hold, equity markets are typically faster to recognize the potential of structural reforms. As a result, Indian markets have become the 7th largest in the world, bigger than even Germany and Canada.
Global Market Capitalization and GDP (USD Billion)
Farmer Protests
Empirical evidence from around the world has shown that Agricultural reforms reduce poverty and improve crop yields. Such reforms include reducing state subsidies and creating market pricing mechanisms to enable farmers to take greater ownership of their crop-mix and therefore, profits.
India's agricultural reforms are purposed to give farmers direct access to grain markets and eliminate venal middlemen. However, the farmers, fearful of change and long addicted to the Government-guaranteed minimum prices have wrongly but understandably risen in protest. They refuse to switch to higher-margin crops like lentils, corn or cotton opting instead to only grow the subsidised crops - rice & wheat.
Producer Protection Data - OECD
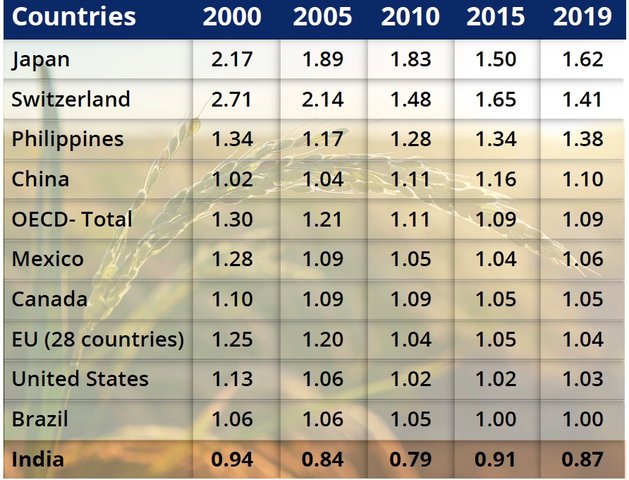
Producer protection is the ratio between producers' (farmers) average price as against average global prices. The coefficient of 1.05 for Canada in 2019 suggests that, overall, Canadian farmers received prices that were 5% above international market levels and were protected more than the Indian farmers who received 13% lower prices. The new farm bills are meant to help the farmers diversify their crops and sell at market prices, thereby giving them a fair shot at prosperity.
A Growth Budget
The Indian budget announced on 1st Feb '21 is designed to ignite a cycle of long-term growth, albeit it comes with a widening short-term fiscal deficit. The Government seems to have struck a sound balance between the Long & Short-term initiatives. Like most countries combating the economic devastation wrought by the pandemic, India has launched a strong fiscal stimulus and several micro-level initiatives with a mix of welfare and infrastructure investment measures.
The most reliable way to make wealth distribution more equitable and sustainable is to create jobs.
The sharp 26% jump in Capex allocation is just the job-recipe needed. Such supply-side reforms have persistent long term benefits rather than cash handouts which only generate a one-time demand fillip.
The budget also contained credible solutions for consolidation of stressed assets and recapitalization of banks. This should allow credit to start flowing again, thereby powering economic activity. According to the IMF, India will be the fastest-growing large economy in 2021, with its GDP expanding by 11.5%.
Climate Action
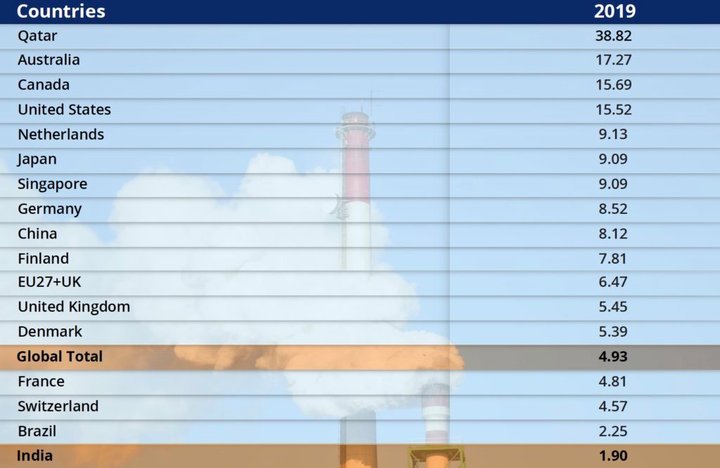
India is the third-ranked carbon emitter globally, responsible for 7% of all emissions, while China, at pole position, contributes to 28% of global emissions. However, considering that the developed world continues to outsource its manufacturing to China and services to India, a reasonable proportion of the developed world's carbon footprint is unfairly represented in China and India.
Despite that anomaly, according to the European Union's data, the carbon footprint per capita of developed countries is much higher than that of developing and emerging countries. This is simply a reflection of the higher consumption by the rich as against the poor. The journey from poverty to middle-class and onward to affluence is characterized by an increased carbon footprint. Since India has a relatively low income per person, it consequently has a very low carbon impact per capita. The data below shows that the average American has a carbon footprint of 8.2 times that of the average Indian. In fact, Indian emissions per capita are less than half the global average.
India has been steadily reducing its share of global coal power development, from 17% of the world pipeline in 2018 to 12% in 2020. As per the Climate Action Tracker (CAT), India, with its current policies, is on track to achieve its Nationally Determined Contributions (NDC) target under the Paris Agreement.
Carbon Emissions per Capita