Flat on the outside

12 AUG, 2026



Look at the S&P 500 this month and nothing happened.
The index sits a few percent below its high, still miles above the March low. Earnings are strong. Strategists are calm. A boring July, by 2026 standards.
Now look inside it.
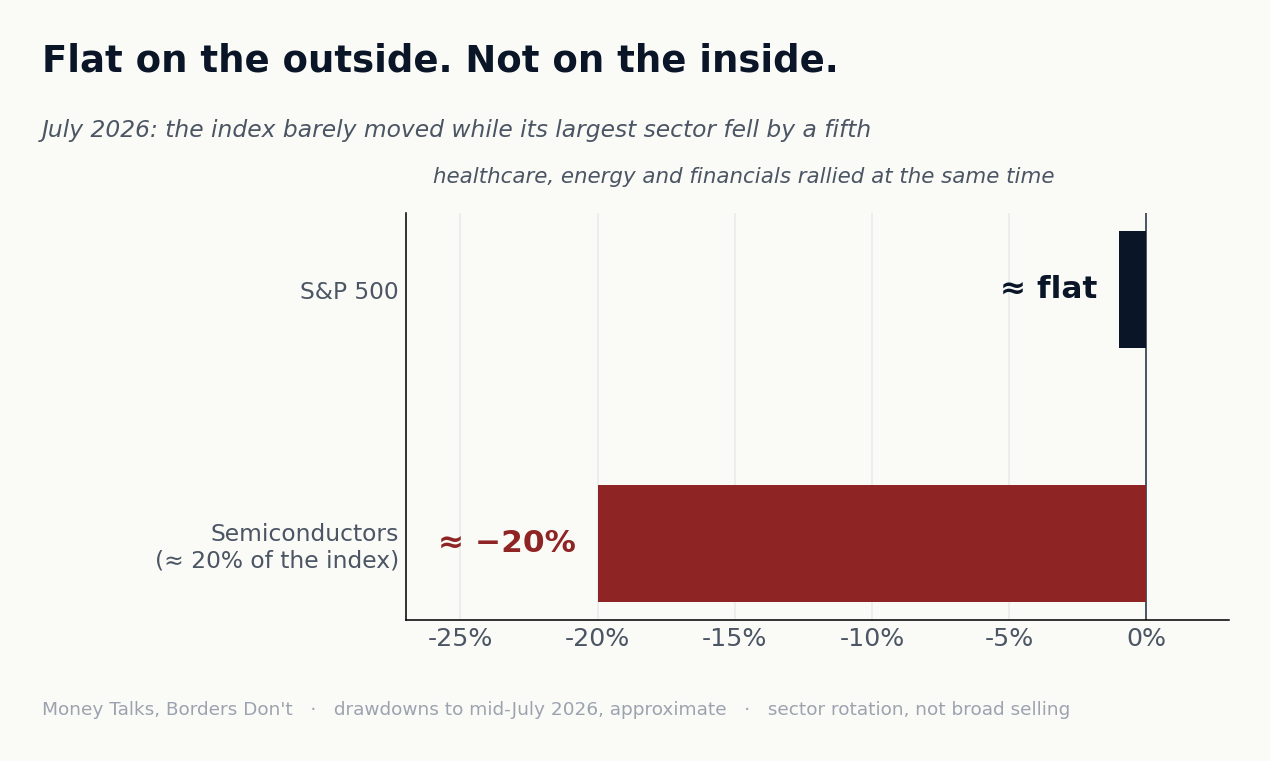
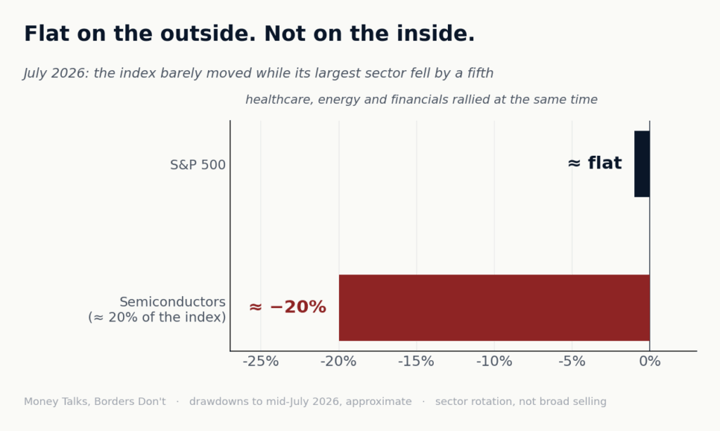
Semiconductors, which grew into roughly a fifth of the entire index, fell about 20%. At the same time healthcare, energy and financials rallied hard. Add it up and the index barely moved.
The strategists have a word for this. Rotation. Money isn’t leaving equities, it’s moving within them, out of the momentum trade and into everything else. As a description of the market, it’s reassuring.
As a description of your collateral, it might be the opposite. Because if you’ve borrowed against a portfolio, one question matters more than anything the index does.
Which July did you have?
The bank doesn’t lend against the index
Here’s the thing about a Lombard loan that stays invisible until it doesn’t.
The margin call isn’t triggered by the market. It’s triggered by the ratio between your loan and your pledged portfolio. Your portfolio. Not the S&P, not the MSCI World, not the market in any general sense. The specific basket of things you handed over as collateral.
The index can be flat while your basket falls 15%. This month, for a lot of tech-heavy portfolios, that’s exactly what happened.
And there’s a detail that makes 2026 particular. Margin debt, the amount borrowed against securities, was already flagged at record highs before the spring pullback. A market with record leverage inside it is a market where sector moves get amplified on the way down, because leveraged holders all need to sell the same thing at the same time.
So the question isn’t whether markets are calm. They are, on the surface. The question is how much distance sits between your portfolio and your trigger.
That distance is a number. Let’s calculate it.
The distance is one line of arithmetic
Take the standard setup. Margin call when the loan reaches 70% of the portfolio’s value. Loan constant, interest paid as you go.
How far can the portfolio fall before you get the call? One line:
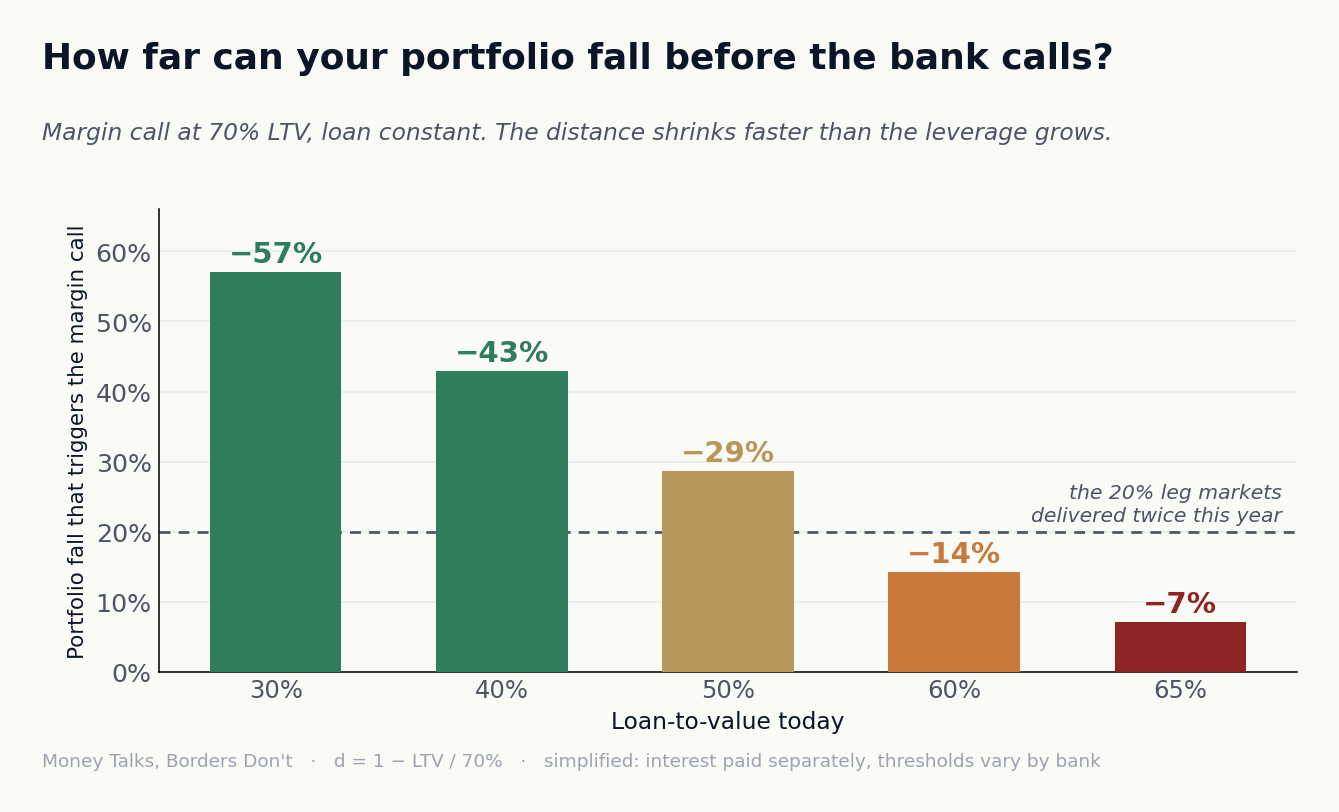
distance = 1 − (your LTV today ÷ 70%)
That’s it. And the results surprise people, because the distance shrinks much faster than the leverage grows.
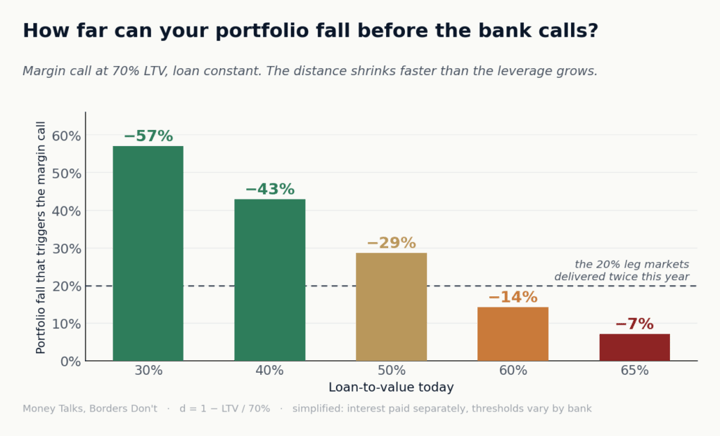
At 30% LTV you can absorb a 57% fall. That’s a once-a-generation crash, with room to spare.
At 40%, you absorb 43%. Still comfortable. A 2008 happens and you’re bruised, not called.
At 50%, the distance is 29%. Now you’re inside the range of an ordinary bad year.
At 60%, it’s 14%. A rough quarter.
At 65%, it’s 7%. A bad month. This month, for some portfolios.
Notice the shape. Going from 30% to 50% LTV feels like a modest increase in borrowing. It cuts your crash tolerance in half. Going from 50% to 65% cuts what’s left by three quarters. Leverage is linear. The distance it burns is not.
And notice the dashed line on the chart at 20%. That’s the size of the sector leg the market has now delivered twice this year: once in the spring pullback, once in July’s rotation. Any LTV above roughly 56% sits within range of a move that has already happened, twice, in the last five months, in a year the index would describe as fine.
Two families, one month
Now the example that turns the arithmetic into a story, because this is where concentration walks in.
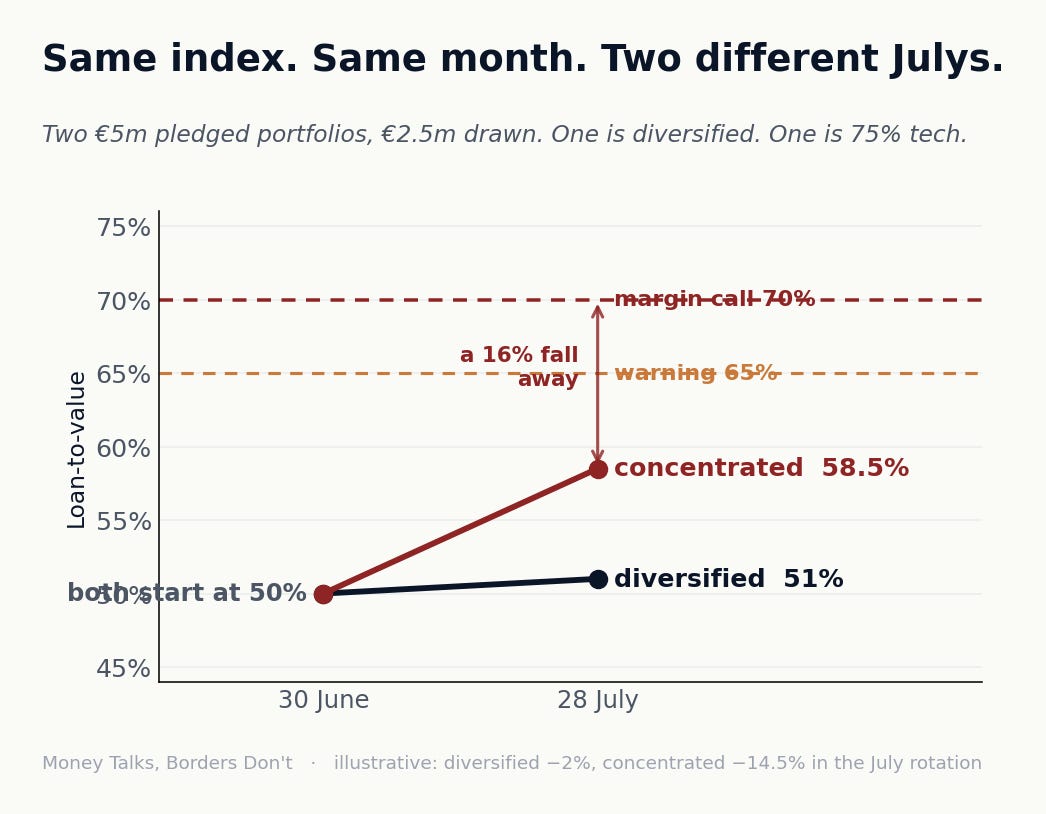
Two families. Same numbers on paper: five million pledged, two and a half million drawn, LTV of 50%, margin call at 70%. Identical risk, if all you read is the loan file.
Family one is diversified. Bonds, global equities, some funds, cash. In July’s rotation the winners offset the losers and the portfolio slipped maybe 2%. Their LTV drifted from 50% to 51%.
Family two is 75% in tech and semiconductors. Not recklessness: it’s what made the money, it’s what they know, and it had been the best trade in the world for eighteen months. In July the tech slice fell 20% while the rest gained a little. Portfolio down roughly 14.5%. Their LTV jumped from 50% to 58.5%.
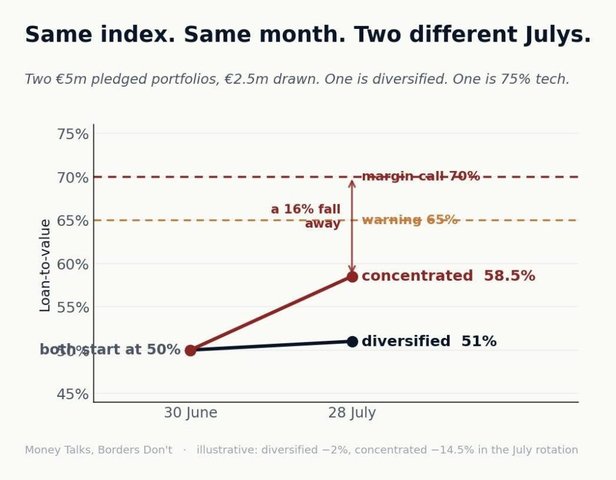
Same index. Same month. Family one had a boring July. Family two burned more than half the distance to their trigger in four weeks, in a market everyone describes as calm.
Run family two through the arithmetic now. At 58.5%, the remaining distance is a 16% fall. The market has produced a 20% sector leg twice since February. They are one repeat away from the phone call, and the index will look perfectly normal on the day it comes.
One more turn of the screw, because this is how it actually goes. Banks don’t just watch the ratio. In stress, they review the collateral itself, and concentrated books are exactly where lending values get cut. The same portfolio that’s falling is also being haircut. The trigger moves toward you while you move toward it. Anyone who was leveraged on single names in 2008 or in 2022 knows the feeling.
Three numbers to know before the autumn
We keep circling the same instinct in this newsletter. Too many banks: give each a role. Currency leaking from every trade: manage it once. Structures that are correct but not real: make them real before someone checks. This month’s version is about knowing your own numbers before markets get interesting, and there are only three.
Your LTV, today, on your actual portfolio, not on a statement from March.
Your distance, from the one-line formula above. If it’s bigger than 40%, sleep well. If it’s under 20%, you’re inside the range of moves this year has already produced, twice.
Your concentration, which is the honest question. What share of the pledged portfolio is one theme, one sector, one name? Because family one and family two had the same LTV and completely different Julys, and nothing in the loan paperwork showed the difference.
None of this says deleverage, and none of it is a forecast. Lombard credit remains the cheapest, most flexible liquidity a portfolio can produce, which is why this newsletter exists in the first place. It says know the number. The families who get hurt by margin calls are almost never the ones who took too much risk knowingly. They’re the ones who never calculated the distance, because the index looked calm.
The index is flat. That was never the question.
For analysis, not advice. Thresholds, lending values and margin mechanics vary by bank and by facility; the worked example is illustrative and simplified. Every situation should be assessed with your own advisors.
Sources & notes
On the July rotation: through mid-July 2026 the technology and semiconductor complex saw a drawdown of about 20%, with semiconductors carrying roughly a 20% weight in the S&P 500, while healthcare, energy and financials rallied and the index itself stayed roughly flat; commentators characterised it as rotation within equities rather than broad selling (Forbes, 21 July 2026). The index had earlier risen above 7,600 before slipping more than 4%, and stood about 19% above its late-March low in early July (U.S. Bank, 6 July 2026). The spring episode: the index peaked on 25 February and bottomed on 30 March, an environment in which record-high margin debt had been flagged as a warning sign beforehand (IO Fund, April 2026). Late-July sessions added geopolitical pressure through oil (CNBC, 23 July 2026).
The distance formula assumes the loan is constant, interest is paid out-of-pocket rather than capitalised, and the margin-call threshold applies to the market value of the pledged portfolio. Real facilities differ: banks apply lending values by asset class, can revise them, and concentrated collateral is typically where advance rates get reduced in stress. The two-family example is illustrative: the −2% and −14.5% July outcomes follow from the stated allocations and the sector moves above, and describe no actual client.
The sector figures in the first chart are approximate and directional, as flagged on the chart itself.
References: Forbes (21 July 2026), U.S. Bank Asset Management (6 July 2026), CNBC (23 July 2026), IO Fund (April 2026), and contemporaneous market coverage.