Global emerging markets: Are investors missing out on a rare entry point?
29 JUN, 2023

By Raheel Altaf, manager of the Artemis global emerging markets equity strategy
Raheel Altaf, manager of the Artemis global emerging markets equity strategy, addresses some of the concerns investors have regarding the asset class, highlights why there may be misconceptions, and explains why investors could be missing out on an attractive entry point.
Emerging market equities have underperformed developed markets over the last decade. Some investors seem to have given up on the asset class as a result. But are they missing out on a rare entry point?
What is putting investors off emerging markets?
Attractive valuations
Emerging market stocks are trading on multi-decade valuation lows against developed markets across a range of metrics. They remain out of favour and extremely cheap relative to US stocks.
Emerging markets are cheaply valued, but not deservedly so.
Shiller P/E by region
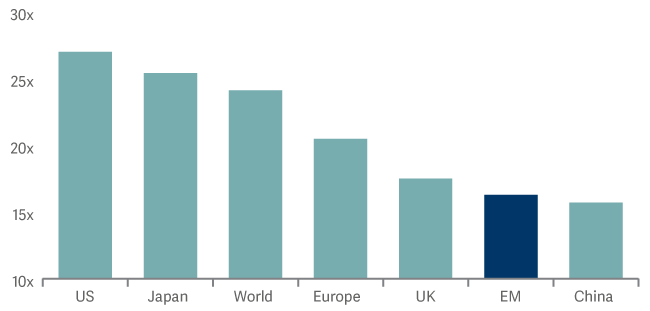
Source: Bloomberg as at 12 May 2023. Shiller P/E is the long-term price earnings ratio computed by dividing price by 10-year average real earnings per share. Real earnings per share is computed by adjusting the EPS ratio for the country’s consumer price index (CPI).
Shiller P/E – emerging markets versus S&P 500Shiller P/E – emerging markets versus S&P 500
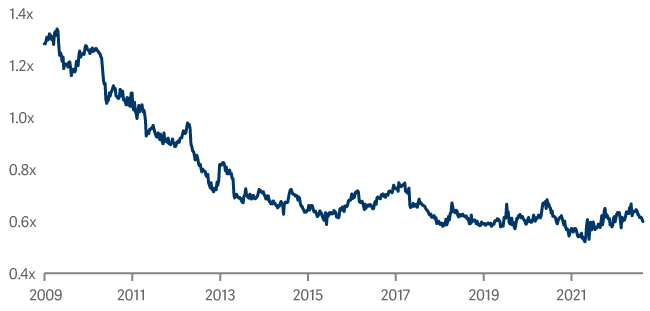
Source: Bloomberg as at 30 April 2023. Indices are: MSCI for EM, Asia ex-Japan, UK and Europe, S&P 500 for US and Topix for Japan.
We have been using our quantitative process, SmartGARP, for nearly 30 years to run a range of funds focused on different regions. SmartGARP aims to identify companies with superior fundamental growth. It uses Value-per-share (VPS) – capturing trends in earnings, cash flows, dividends, operating profits and assets – as a starting point for evaluating companies. It looks at 6000 companies worldwide.
As you can see from the chart below, SmartGARP is currently finding its best opportunities in emerging markets.
Emerging markets fundamentals compared to other regions: the SmartGARP perspective
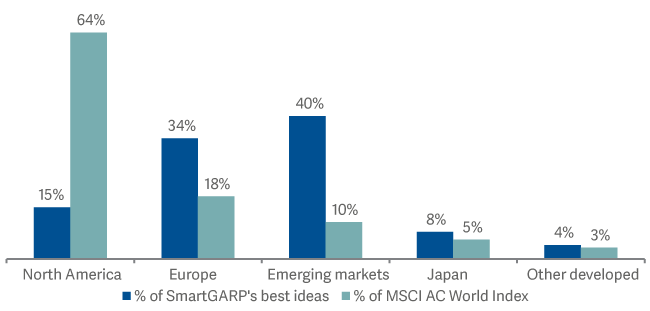
Source: Artemis as at 30 April 2023.
Political risk can be managed
When looking at emerging markets, investors tend to focus on political risk, but we believe country risk exposure can be managed. It tends to hit headlines but does not necessarily affect corporate fundamentals.
For example, in 2022, the Turkish economy was battling against inflation near 80% and persisting in unconventional monetary policies. Despite this, its stock market was the best performer in emerging markets over the year, rising over 84% in US dollar terms. For our Turkish holdings, profit growth remained strong against the backdrop of economic headwinds. Glass producer Sisecam, bottler Coca Cola, Icecek and telecom operator Turkcell were good examples.
What about China?
While negative sentiment about China has dominated over the last few years, the Chinese economy now appears to be in a sweet spot from an investor’s perspective.
The country is seeing low inflation, monetary policy in easing mode and improving economic growth from lower levels. China’s reopening after the stringent Covid controls is releasing suppressed demand in all areas. Q1 GDP figures showed a strong recovery in exports and retail sales.
A sustained recovery is likely to be the key determinant in changing sentiment towards emerging markets. This should lead to a better outlook for Chinese stocks, particularly given their depressed valuations versus history.
It's also worth noting that investors tend to focus on headline figures such as GDP or manufacturing output, which have the potential to disappoint. Meanwhile, news reported by companies has been positive.
How is the Artemis Funds (Lux) SmartGARP Global Emerging Markets Equity fund positioned to benefit from market conditions and manage the risks?
For a number of years, we have seen speculation following surging share prices, which has reduced the focus on fundamentals. This has created excessively high valuations in some parts of the market that have now started to unwind.
We think this unwind has further to run and are therefore cautious on expensive companies that show signs of investor exuberance. We see less risk in companies that have been overlooked and trade on low valuations, but where there are signs of improving fundamentals.
This leads us to be overweight China, Brazil and Turkey at the country level and underweight India, Taiwan and Saudi Arabia. At the sector level, insurance, banks and energy feature as the largest overweights with materials and semiconductors the largest underweights.
Our value bias remains substantial, with the fund trading on a p/e of 6.4, compared to the benchmark index at 11.9 (a 46% discount). The fund remains well diversified, with high active share and contrarian positioning.