Is 2025 a ‘golden year’? Gold surges past $4,000 an ounce – here’s what experts say

8 OCT, 2025
By Joanna Piwko from RankiaPro Europe

Gold has surged to a record above $4,000 (£2,985) per ounce, as investors seek safe-haven assets amid global economic and political uncertainty. This marks its strongest rally since the 1970s.
We don't see a significant risk

Regina Hammerschmid, Commodities Portfolio Manager at Vontobel
The spot price of gold surpassed the well-known $4,000 per troy ounce threshold early this morning and continues to break new records every day. This year alone, gold has already hit 52 new all-time highs. The year-to-date return is approaching 54%, marking the highest annual gain since 1979.
In September, gold ETF flows recorded their best month ever. Net inflows of $17.3 billion (146 tons) were led by North America ($10.6 billion) and Europe ($4.4 billion), with Asia also contributing to the rise ($2.1 billion).
Although these figures have already set records, we do not see a significant downside risk, given all the structural factors (a weakening dollar, concerns over U.S. debt and government shutdowns, Fed independence, and elevated geopolitical risks) and cyclical factors (a weakening U.S. labor market, Fed rate cuts, and growth concerns driven by tariffs) that continue to push gold prices higher.
We maintain a constructive view on gold

Marco Mencini, Head of Analysis, Plenisfer Investments SGR S.p.A., part of Generali Investments
2025 is shaping up to be a “golden year”: after the first rate cut by the Federal Reserve in mid-September, gold surpassed the $3,800 per ounce threshold.
This is a rally with few precedents, comparable to the surge following the suspension of the Bretton Woods agreements in the 1970s, when the convertibility of the dollar into gold ended.
Will the rally continue?
We maintain a constructive view on gold, supported by structurally strong purchases from central banks—responsible for 94% of the rally since 2022, after quintupling their acquisitions by freezing Russia’s dollar assets—as well as sustained interest from financial investors.
In particular, gold ETFs have attracted between $25–30 billion so far this year, roughly equivalent to 10% of annual mining production. Additionally, hedge funds have concentrated nearly half of all their commodity exposure in U.S. markets on gold.
In this context, the market already anticipates further rate cuts in the U.S., which could be more significant now that Stephen Miran, a trusted advisor to President Trump, is on the Federal Reserve Board. This is compounded by the fact that Jerome Powell’s term as chairman expires next May. A less restrictive monetary policy could translate into higher inflation and, consequently, rising long-term interest rates, which would lead to falling bond prices, setbacks in equity markets, and an erosion of the dollar’s status as a reserve currency. This environment would be favorable for safe-haven assets: it is estimated that if just 1% of the private capital currently invested in U.S. government debt were redirected to gold, the price could reach nearly $5,000 per ounce.
How to gain exposure to gold?
The market offers two financial alternatives to position oneself in gold: producer stocks and exchange-traded funds (ETFs).
Despite the solid returns of producer stocks so far this year, their valuations remain attractive. Many companies are generating free cash flow (FCF) yields between 7% and 9% (high single digits) and between 10% and 12% (low double digits) relative to their market capitalization. The figure varies by company, but considering also the low levels of leverage, current levels offer favorable prospects.
It is often assumed that gold producers’ profitability cannot keep pace with the metal’s price. However, EBITDA data from the main sector ETFs—such as GDX (VanEck Gold Miners ETF)—disprove this perception.
3 Reasons why gold stocks still have upside

James Luke, Commodities Fund Manager at Schroders
Gold miners are generating record margins and have significantly strengthened their balance sheets, yet their valuations are still not fully reflected in the market. The market is only just beginning to pay attention.
Despite the recent boom, we must remember that gold equity funds have experienced net outflows of nearly $5 billion over the past year and a half. Investors who are not invested wonder if they’ve missed the boat, while those who are invested ask whether it’s time to sell. However, we believe gold stocks are not expensive—at least from three perspectives.
- Gold stock performance remains disconnected from record free cash flow margins
Normally, gold stocks outperform physical gold when their cash flow margins expand and underperform when margins contract. Since late 2023, margins have expanded to unprecedented levels as interest in gold has grown. This margin expansion is explained by gold’s role as a monetary asset—or “money that is not debt.” At the same time, producer inflation (partly due to low energy costs) has decreased. Current margins are 100% higher than the last peak during the summer of COVID.
Chart 1: Gold stock returns have not kept pace with the expansion of free cash flow margins.
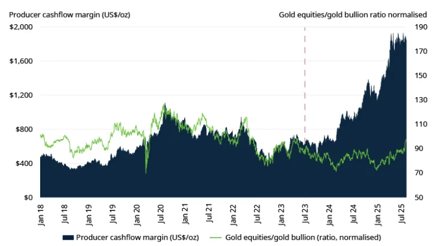
There is still room for gold stocks to outperform bullion. Gold stocks would need to outperform gold by about 30% just to return to the relative valuation levels of 2020, when margins were half of what they are today. In addition to higher margins, companies have much stronger balance sheets and are delivering more shareholder value through share buybacks and dividends. If gold stocks reflected these new margins, their prices could potentially double relative to gold, assuming gold itself does not continue to rise.
In the last quarter (Q2 2025), producers generated roughly 50% more free cash flow than consensus estimates. Realistic forecasts, disciplined management, and a solid macroeconomic environment for precious metal prices are having a transformative effect.
- Reasonable valuations
Margins are high, yet valuations remain reasonable. We examine various valuation and return metrics—from long-term discounted cash flows (Price to Net Asset Value) to short-term profit and cash flow metrics (EV/EBITDA, cash flow yields) or return measures such as ROIC, as well as sector-specific metrics like EV per ounce of resources. Overall, valuations appear reasonable, and they are based on conservative gold price assumptions, estimated below current prices. Additionally, averages are often skewed by the largest players.
Chart 2: P/NAV valuations remain well below the long-term average.
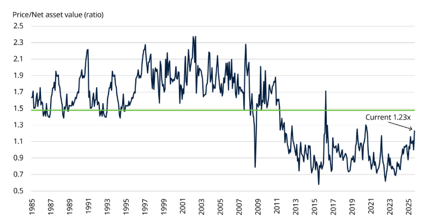
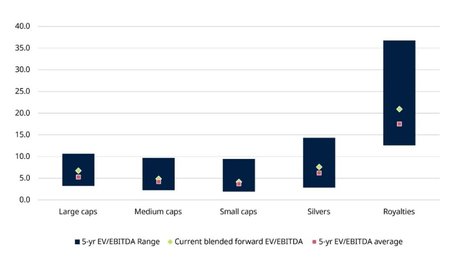
Chart 3: EV/EBITDA multiples are still near the lower end of the 5-year range across producers.
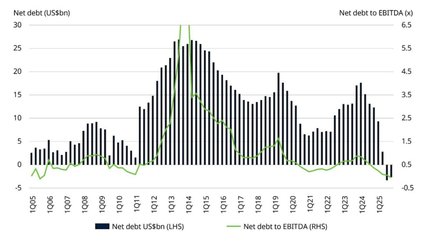
It’s worth noting that stronger balance sheets provide an additional layer of financial security not usually present during periods of cycle exuberance. This balance sheet strength allows companies to increase returns to shareholders through dividends and share buybacks, while reducing leverage. Many companies have shifted from “net debt” to “net cash.”
Chart 4: Balance sheets shifting from net debt to cash as high free cash flow enables deleveraging.
- No signs of euphoria in the sector
We do not believe Western investors are blindly buying gold. In fact, until recently, they have been “selling the rally.” The push we’ve seen from 2022 through the second half of this year has been driven mainly by emerging-market central banks and, to a lesser extent, households and institutional investors in emerging markets. Many Western investors remain cautious after a decade of poor gold performance between 2005 and 2015 and are only now reconsidering the asset. In this fiscal and geopolitical context, we expect much more aggressive participation from Western investors.
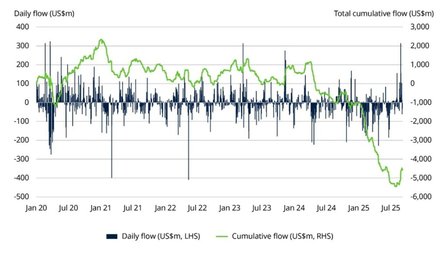
Chart 5: Gold producer equity ETFs (cumulative flows from 2020 to the present)Chart 5: Gold producer equity ETFs (cumulative flows from 2020 to the present)
We expect gold demand to increasingly shift from private investors to pension funds and other asset managers

Claudio Wewel, FX Strategist at J. Safra Sarasin
The gold rally gained further momentum when U.S. labor market data for August turned out to be substantially weaker than expected. This reinforced the path of rate cuts implied by the U.S. market, reducing the opportunity cost of holding gold. Although interest rates have recently played a smaller role than in the past in gold price dynamics, they still exert some directional influence on the precious metal, along with a weaker dollar. We have also noted recently that the cryptocurrency sector is showing a growing interest in gold, which could add further tailwinds.
Although demand has been strongly driven by central banks in the years following Russia’s invasion of Ukraine, total central bank purchases are likely to decline for the full year 2025. However, we expect central banks to buy opportunistically during dips, effectively giving the gold market a “central bank put.” In contrast, net ETF inflows have been significantly higher in 2025 compared to the previous three years, bringing total gold holdings in ETFs to over 3,800 tonnes. This level is close to the peaks seen during the risk-asset selloff in 2020 due to the pandemic and in the months following Russia’s invasion of Ukraine in 2022. Since the beginning of this year, ETF purchases have largely been driven by specific events, as shown by weekly net inflows.
Looking ahead, we expect gold demand to increasingly shift from private investors to pension funds and other asset managers. Recent surveys among fund managers reveal that long-term strategic allocations to gold remain quite low, around 1–2% of portfolios, implying that gold remains “underrepresented” in portfolios. With gold showing stellar performance in 2024 and 2025, this situation is set to change, as the “opportunity cost of not holding gold” has grown significantly. Instead of the traditional 60-40 allocation between equities and bonds, asset managers are considering substantially increasing gold allocations, given its resilience as an inflation hedge in an environment of rising long-term bond risk premiums. Some banks have recently suggested a 60/20/20 portfolio strategy, with equal weighting between gold and fixed income. While this may represent the upper limit, increasing allocations to 5% would still double or triple current gold positions in asset manager portfolios.
Since gold has reached the psychological threshold of $4,000, what should we expect next for the precious metal? In our view, several factors will continue to support gold’s upward trend. Beyond concerns about the integrity of U.S. institutions, gold should continue to rise amid fears about fiscal and debt sustainability in the U.S. and other developed markets. In this “perfect storm,” gold will also benefit from ongoing geopolitical fragmentation, which is driving long-term de-dollarization. In this regard, gold is increasingly seen as a way to “short the dollar.”
Although it is difficult to make a reliable forecast for the levels gold might reach in 2026, it is instructive to look at historical gold rallies. Unlike equities, gold experiences periods of strong upward movement, outperforming most risk assets, but also long stretches of mild upward or even negative performance. After World War II, gold had its strongest performance in the 1970s, generating a cumulative return of 1,355%. The 1970s were followed by two decades of negative performance. However, it regained momentum in the 2000s, nearly quadrupling in price. Since January 2020, gold has gained 163%. We therefore believe there is still room for further upside, recognizing that this implies an upside risk to our end-2026 target of $4,500 per troy ounce. Inflows from the cryptocurrency sector could provide an additional boost, given the crypto market’s large size, with a market capitalization of around $4 trillion.
What are the downside risks? Certainly, gold’s bull cycle will end at some point, but in our view it is difficult to identify near- to medium-term negative factors for gold. Many of the key concerns that have fueled gold’s rally are likely to persist: worries about the integrity of U.S. institutions, particularly the Fed’s independence, concerns over fiscal and debt sustainability, and the trend toward geopolitical fragmentation. For gold to reverse course, a major policy shift in the U.S. would be required, which we see as rather unlikely. Historically, major risk-asset selloffs have triggered large-scale gold liquidations, leading to short-term pullbacks of around 10% (for example, the 2020 Covid-related selloff and the 2025 Liberation Day selloff). However, gold has typically rebounded quickly from such temporary lows, recovering within days, which in our view represents an attractive entry opportunity.